The Act of Flying With Kittens
There have been a lot of things that I have done within the idea of “keeping my wife happy”, but this adventure started out as one of the more extreme examples.
My wife and I have a cat named Finn, who has been with us for a long time. In February of 2024, he got really sick and my wife was making daily trips to him to the vet to figure out what was going on with him. He was lethargic and having trouble judging distances. He was having problems deciding if he could make a jump up or down on to surfaces he has been gracefully traveling to and from for years. Also when he would try to eat, more food would fall out of his mouth than would stay in. 
The vet checked him for abscesses and other injuries. He was battling a fever of 106 degrees Fahrenheit, which is a lot for a cat. Cats usually run a temperature of about 100 degrees F. As the vet was getting ready to sedate Finn so that X-Rays could be taken, it was discovered that there was fluid building up in his abdomen. This prompted the vet to check some other things, and Finn was diagnosed with a condition called Feline Infectious Peritonitis, or more commonly called FIP.
Some websites say the same thing that the vet told me and my wife when we found out about the diagnosis. They say that is incurable and very torturous to go through. The vet encouraged us to put him down that day to minimize his suffering. My wife and I both felt like it was not Finn’s time to go. He didn’t act ready. The vet also told us about an organization that helps people with cats suffering from this condition. It turns out that there is a cure for the condition, however it is not approved by the FDA. My wife and I decided to go down that path of treating him and after three months of daily injections and regular blood work, I am happy to say he is cured and playing like he always had.
What does this have to do with flying from Portland, Oregon to Philadelphia and back in one day, just to pick up two kittens? Some people have asked me if they are out of cats in Oregon. There are still a lot of cats in Oregon that need homes. During Finn’s treatment, my wife got connected with a lot of people all over the world who have been through this ordeal and those who are going through treating their own cats with this condition. One of the people she met is someone who works with a cat rescue in Virginia who had over a dozen kittens surrendered to them that were very sick. My wife saw photos and videos of the kittens and fell in love with two of them. She picked them and got updates on their health as they got better. The kittens did not have FIP. Sadly, some of the kittens were too sick to be saved. Our kittens were not from the same litter, but they were from the same cattery. FIP does have a genetic component, and one of the cats that I brought home had two siblings that were diagnosed with FIP and one did not survive. The other kitten is currently being treated, and both mommas from the cattery had it. After kittens that we got were cured and fixed, the schedule was set for me to fly to Philadelphia to pick them up at the airport.
The reason that I made the journey is because my wife has some medical conditions of her own that make air travel more dangerous for her. I wanted to be sure that she was as safe as she could be, so I volunteered to go.
I have flown a lot over the course of my life, but I have never transported small animals like this before. The kittens were too small and fragile to make it in the animal container area at the bottom of the plane, so I brought them home in a cat carrier that was my carry on. They travelled really well and didn’t freak out as I thought they might. Complete strangers were fascinated by them as well as the idea of flying with kittens. I felt like I was being a bodyguard for two tiny rock stars. 
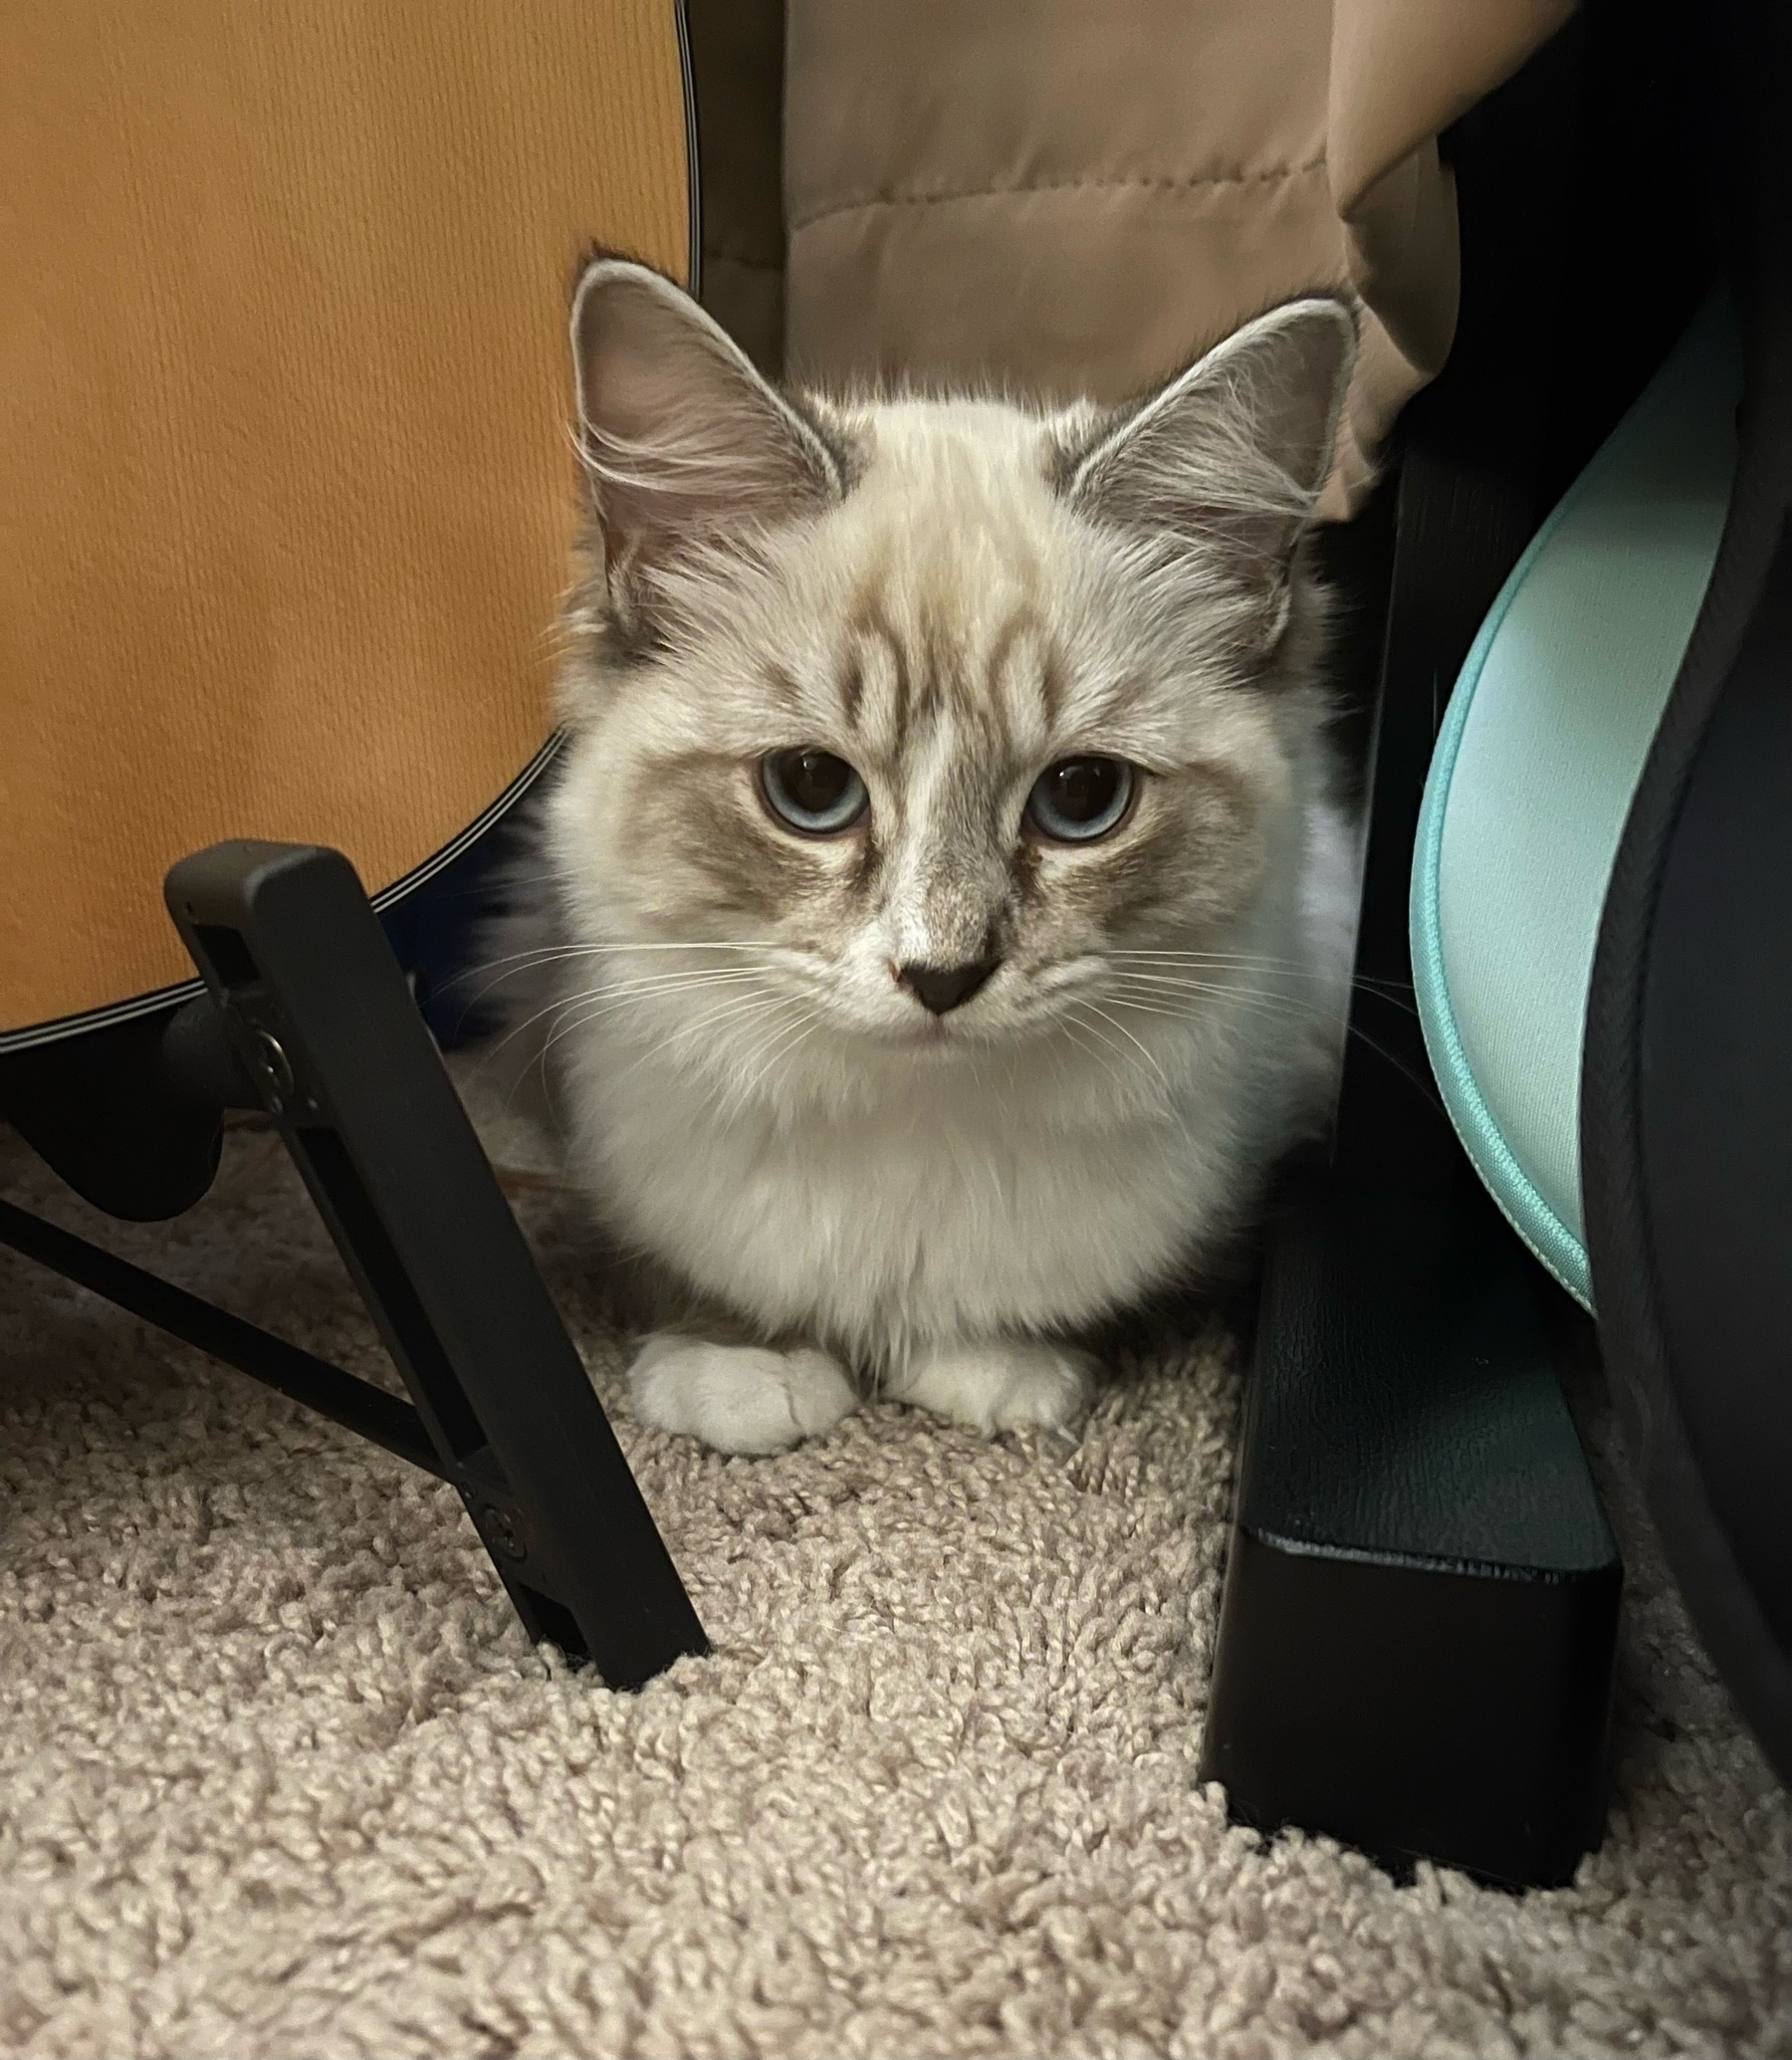
The kittens were given the names of Parchment and Bone at the rescue. The rescue does something where they let donors vote on names for new cats that come in, so they were named after different shades of white. The kittens got new names with in a couple of days of being home. Bone had his name changed to Harley because he instantly purrs like a race car when you pay any attention to him. We considered calling him Ferrari for a short while, but it didn’t seem to fit him as well. Parchment became Daphne. She also instantly purrs, but that was the name that my wife felt suited the fluffy princess. 
We went to these extremes to adopt these kittens because animals with a history of health issues are some of the last to be adopted, if it happens at all. Generally speaking, when people go to adopt a pet, they don’t go looking for project that could be heartbreaking. Harley and Daphne both have bad genetics, being pure bred Ragdolls. Part of learning how to best help cats, as well as their owners, survive FIP, there is a lot information around cats and how to tell if they are sick with something that is learned. No one at our house is a vet, or anyone who pretends to be. We have learned how to tell when a cat has a fever, or when a cat is in pain. My wife and I both feel like we are better equipped than most amateurs to see when they need help and get that help for them. It isn’t just anyone who can summon the courage to give a member of the family 1 to 2 shots per day, every day for three months. Especially when you can tell that the shot itself is painful. Even if after a while, the cat knows that you are trying to help them.
The kittens just turned one and are thriving. They have fit in with the rest of our clatter. They are very confident cats and show us their personalities all of the time.

 This sort of chart is a common tool used by program managers to track the progress of a project based on how the tasks are completed. For me, I am using the tool to make sure that I am doing the stuff that I am supposed to do in the right order. Also, it gives me a chance to see where schedule conflicts may be so that the managers of the different projects can be made aware of them and give them a chance to agree on what the priority is. I did look to see if there are any task management apps that would take the tasks across multiple projects and plot them in a Gantt chart. Sadly, it appears that there isn’t one on the market. There are Gantt tools that are used for managing teams. I am basically a team of one. I solved this problem by finding a